


“Even top-ranked tennis players win barely more than half of the points they play.” So said Roger Federer in his 2024 commencement speech at Dartmouth College. Federer, winner of 20 Grand Slam singles titles, went on to share a statistic that surprised most of his audience. Over the 1,526 singles matches of his career, he won almost 80%. The percentage of points he won in those same matches? Only 54%.
Investors can learn a thing or two from this. Being wrong is part of investing. Forecasts miss, companies disappoint, and the widely anticipated economic outcome often never arrives (recall the “no show” recession that most economists expected by mid-2023). Long time clients have heard us say before that human beings are bad at predicting the future. So, the question isn’t whether you will be wrong; it’s what happens to your portfolio when you are.
How does a 54%-point winner become an 80% match winner? Much of it comes down to how tennis is scored. Points roll up into games, games into sets and sets into matches. At each level, a small but consistent edge compounds into a much bigger one. Just as important is what the scoring prevents. No single point can cost a player more than one point. An embarrassing double fault counts the same as a narrowly missed passing shot, and the next point starts fresh.
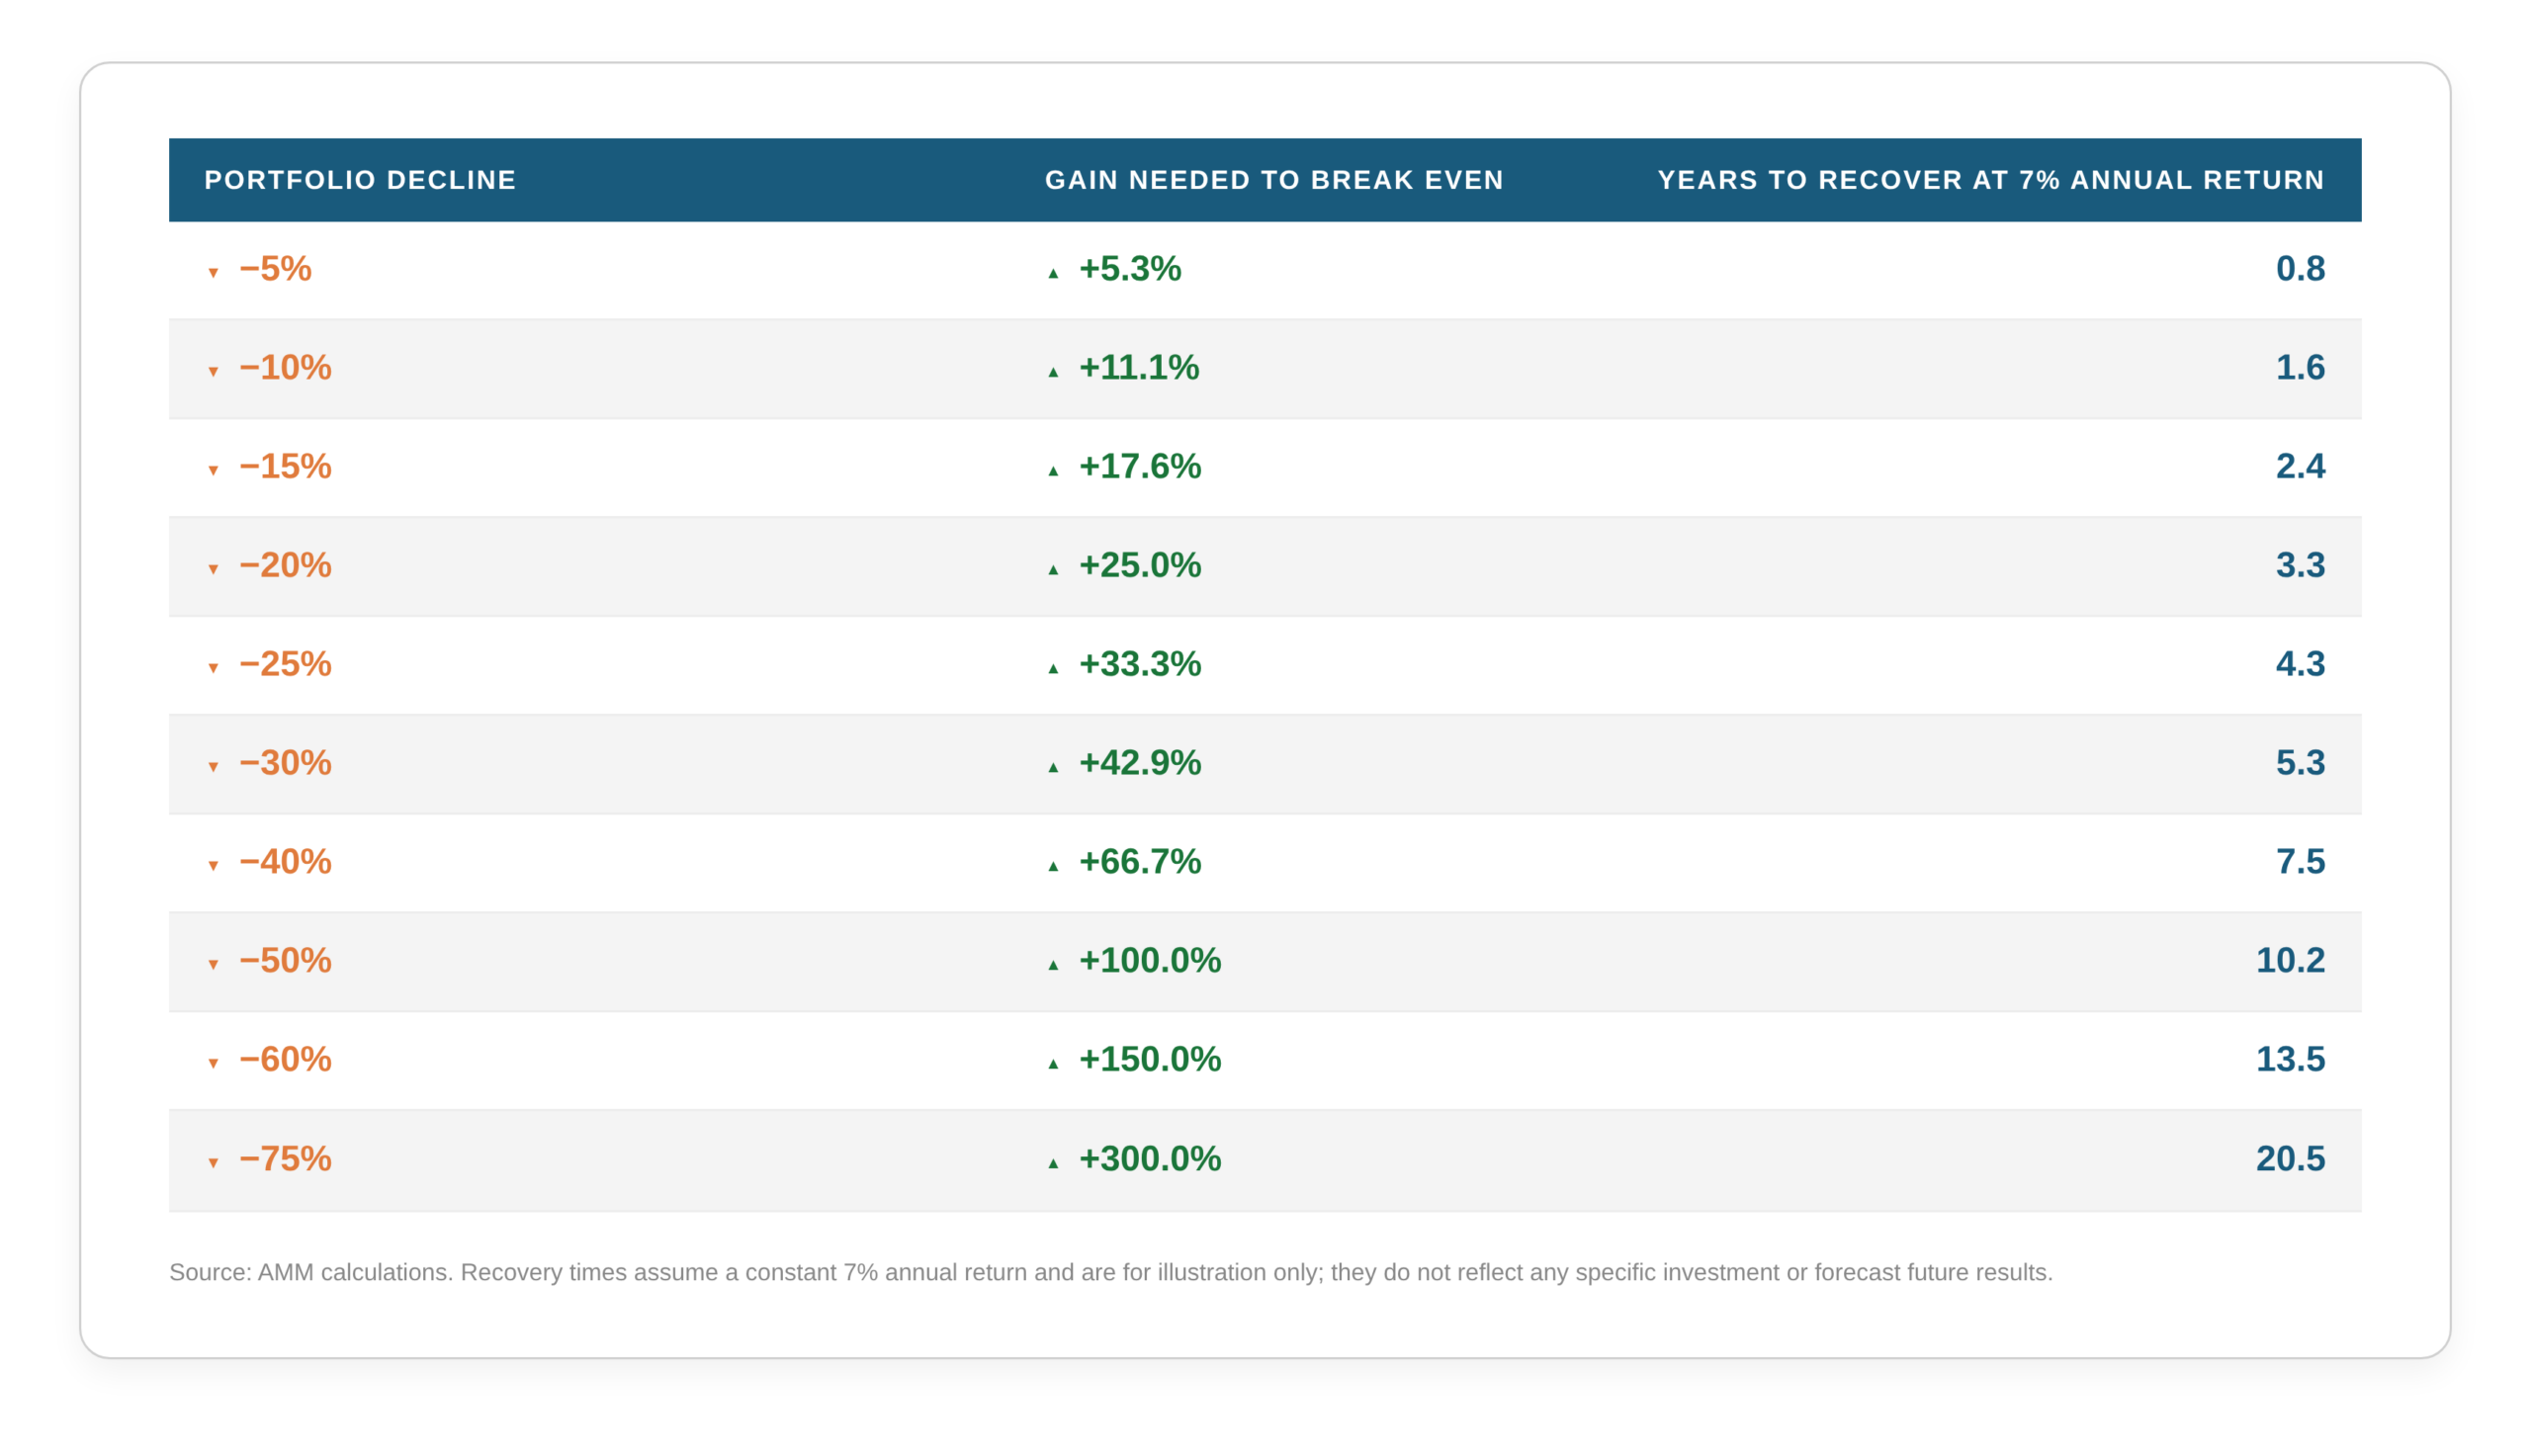
Unfortunately, investing doesn’t work this way. A single decision – a concentrated bet, a reach for extra yield, or a great business bought at the wrong price – can cost far more than one “point”. And losses are not symmetrical. A portfolio that declines 50% needs to gain 100% just to get back to even. In investing, the rules allow you to lose many points at once. So, the protection must be built into the portfolio itself.
Exhibit A: The Math of Losses
Steady Wins
Renowned credit investor Howard Marks made much the same point in one of his famed client memos, “The Route to Performance”, written in October 1990. Marks recounted a conversation with the director of a major Midwestern pension plan whose stock portfolio had been well ahead of the S&P 500 over the prior fourteen years. The secret? Until 1990, the plan had never ranked above the 27th percentile of its peers in any single year. It also never ranked below the 47th percentile. In other words, it was never spectacular; it was just a little better than average, year after year. The result over the full fourteen years: a 4th percentile ranking, ahead of 96% of its peers.
Marks contrasted this with the president of a money management firm quoted in the Wall Street Journal that same year, who argued that to be in the top 5% of managers you have to be willing to land in the bottom 5% as well. Marks strongly disagreed – and so do we. Bold, overconcentrated bets can be wrong just as easily as they can be right, and a mix of great years and terrible years tends to produce a long-term record that is both volatile and mediocre. As Marks put it, “if you can avoid losers (and losing years), the winners will take care of themselves.”
Federer and the Midwestern pension plan arrived at the same place from different directions. Neither needed to be right all the time. What they needed was a modest edge, applied consistently, and the discipline not to let any single mistake knock them out of the game.

Building in Room to Be Wrong
We do not build client portfolios on the assumption that our views will always be right. Rather, we build them so that being wrong – about the economy, a sector, an individual company or the direction of markets – is survivable. One of AMM’s five core principles addresses this directly: “volatility is not risk; risk is the likelihood of permanent capital impairment.” A temporary decline is a lost point. A permanent loss can cost you the match. To keep the former from becoming the latter, we focus on the following:
Diversification: If you’re wrong, you shouldn’t be wrong with your whole portfolio. Spreading investments across asset classes, regions, sectors and individual holdings means any single mistake affects only part of the portfolio, while other holdings, driven by different factors, can help offset it. As we noted last quarter, a 500-stock index fund diversifies single stock risk, but not your exposure to the US stock market. Real diversification means owning assets that respond differently to the same events.
Asset Allocation: Asset allocation determines how much of a portfolio is exposed to the outcomes that would hurt the most. We set the mix of stocks, bonds and other assets based on each client’s risk tolerance, goals and time horizon, and rebalance back to it over time. This helps keep the impact of any bad outcome within a range that both the portfolio and the investor can withstand. That last point is important. Some of the most lasting damage to portfolios comes not from market declines themselves, but from investors selling at precisely the wrong time (i.e. near the bottom).
Price Paid: “The price you pay determines your return” is another of our core principles. Price is also your margin of safety. An asset bought at a reasonable price leaves room for things to go worse than expected. An asset bought at a high price needs the optimistic scenario to play out – and on schedule. Investors who bought the S&P 500 near the peak of the internet bubble in 2000 were largely right about the internet. They were wrong about the price, and spent roughly nine years with negative returns to show for it.
To be clear, none of this is a prediction about where markets are headed. A diversified, valuation-conscious portfolio will rarely top the leaderboard in any given year, especially when a narrow slice of the market is leading the way. There will be years when more aggressive strategies look better. That is a trade-off we are happy to make. The goal is the same one Federer pursued on the court, and the Midwestern pension plan pursued over fourteen years: win a little more often than you lose, never lose so badly you can’t come back, and let consistency compound over time.
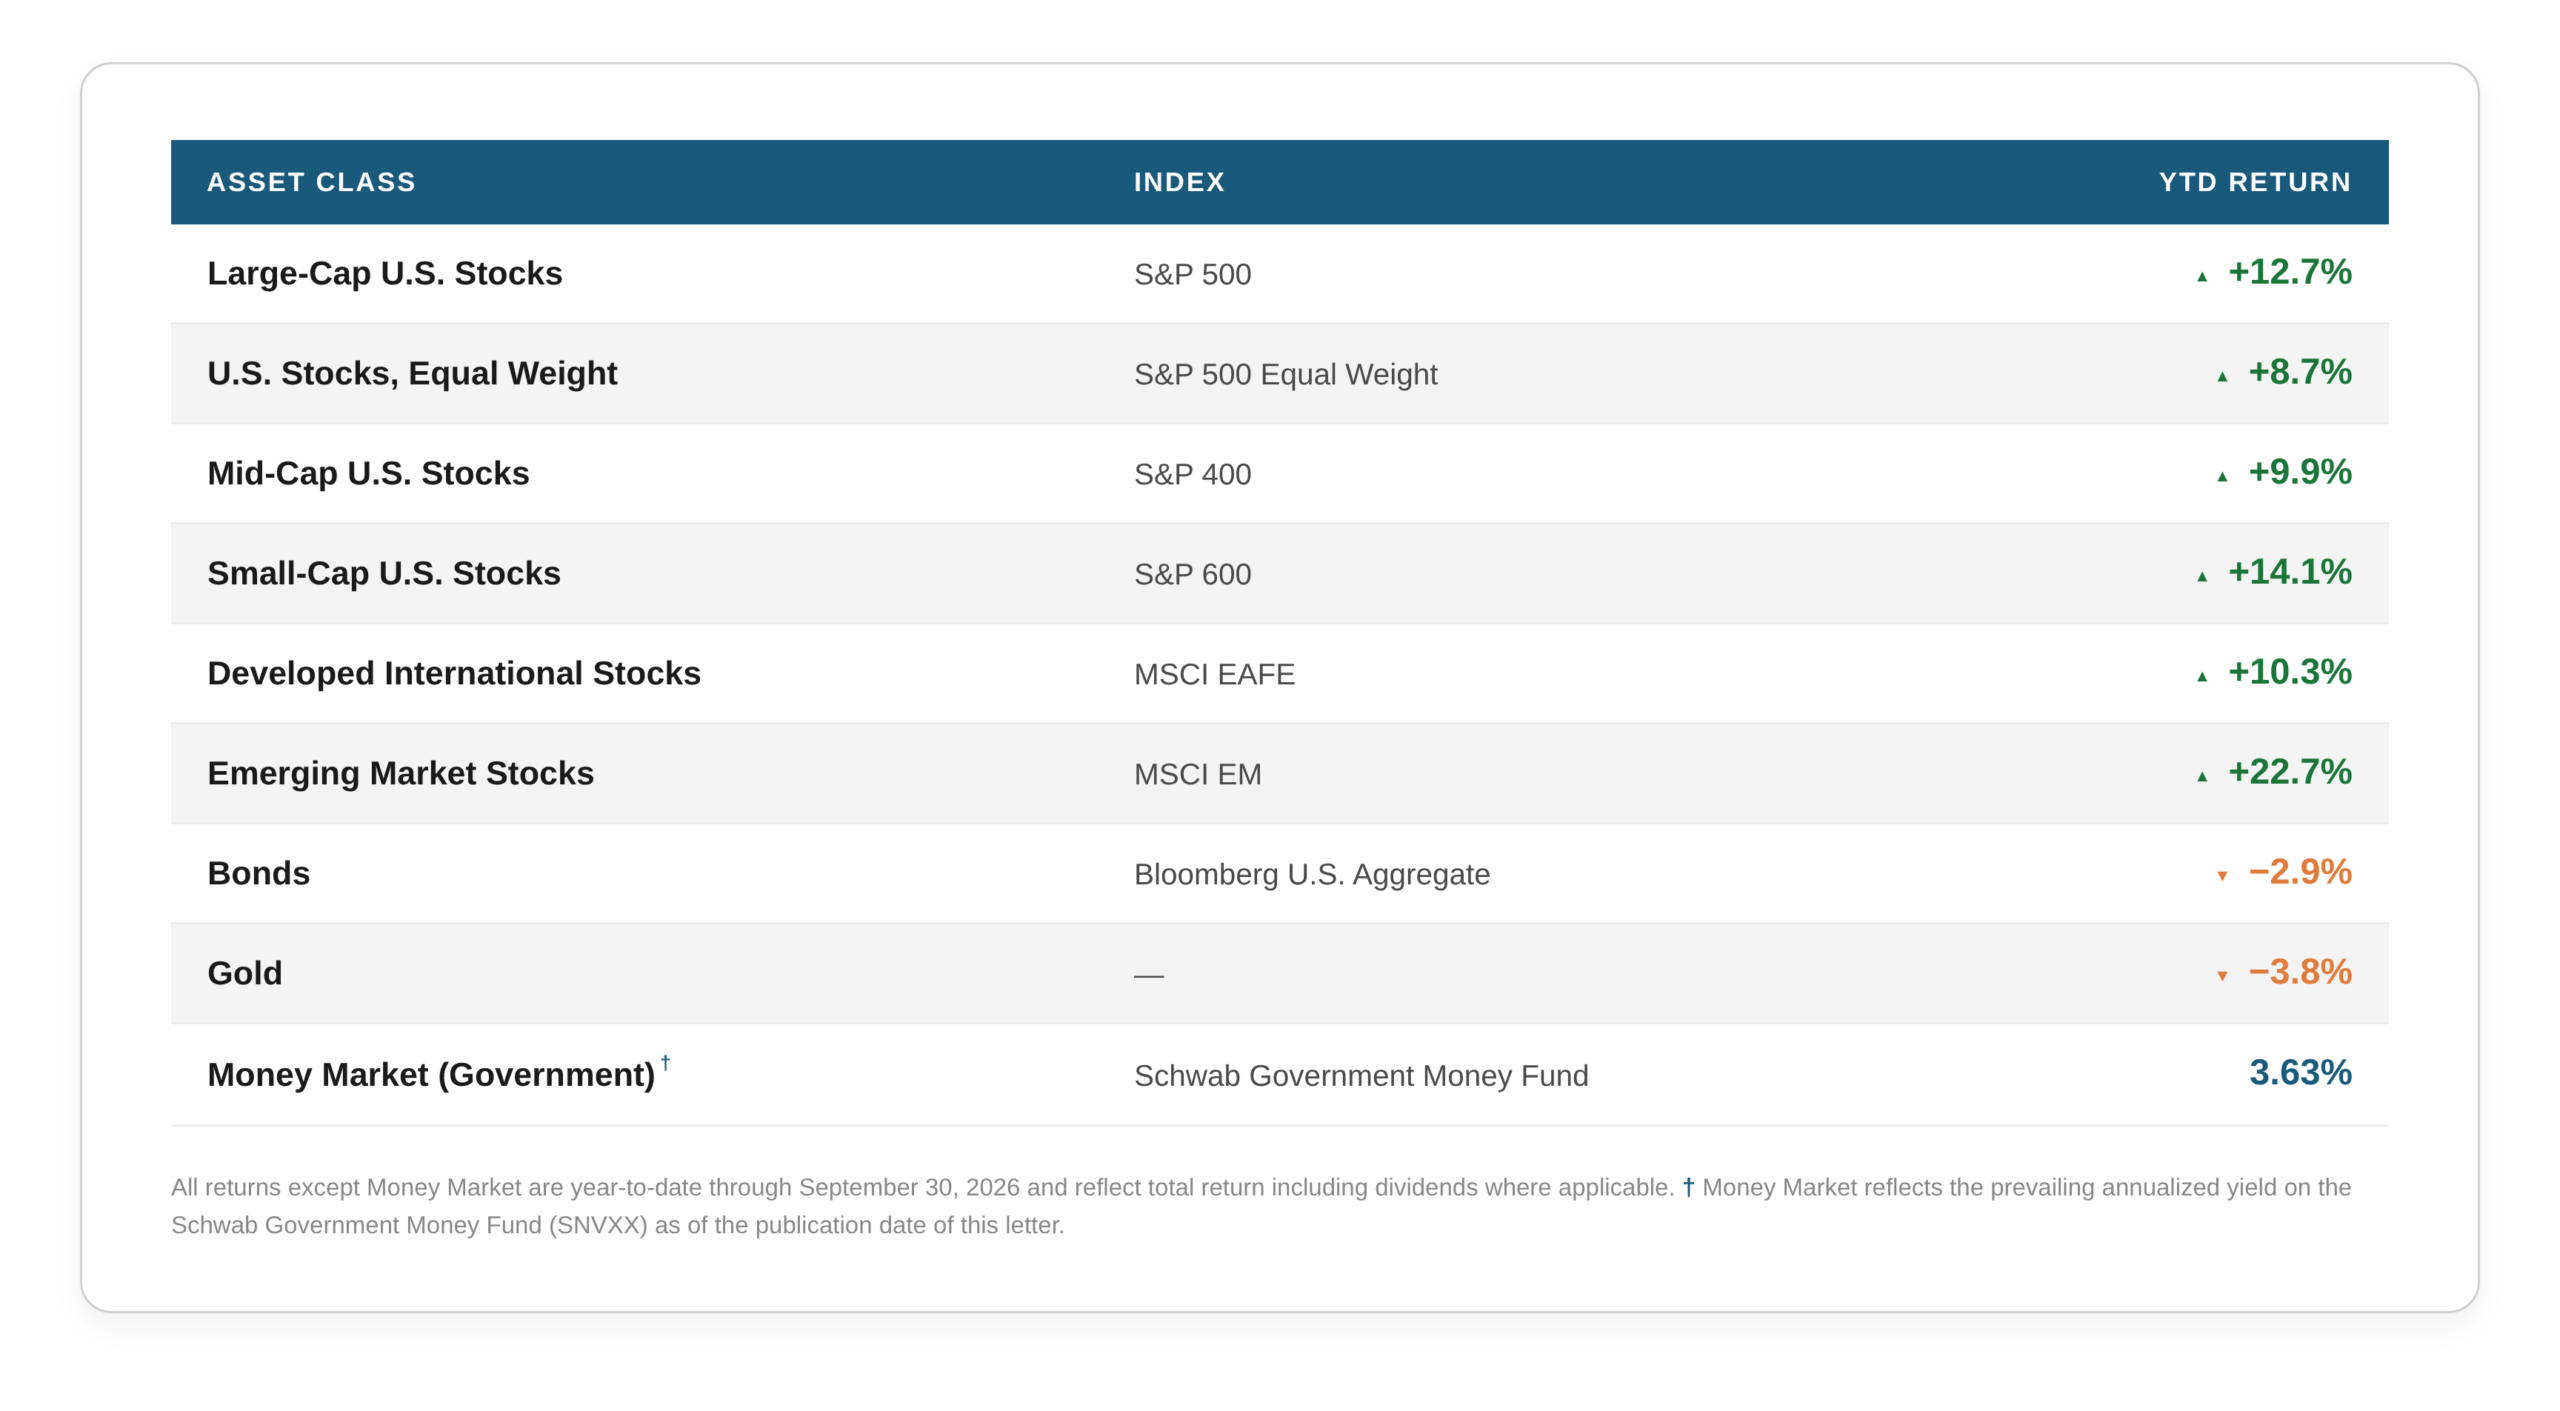
Year-To-Date Performance Review
Current Outlook
U.S. Stocks
If 2026 has had a single storyline for US stocks, it has been the battle between the AI “haves” and “have nots,” and that trade has traveled in both directions. In the first half of the year, companies seen as AI beneficiaries were big winners, led by semiconductor designers, manufacturers and equipment makers. Through June 30, the iShares Semiconductor ETF (SOXX) had returned 112%. Meanwhile, companies seen as threatened by AI lagged badly. Software companies were hit hardest, since AI could erode their long-term competitive advantages, or “moats.” The iShares Expanded Tech-Software ETF (IGV) declined 14% over the same period (Exhibit B).
Exhibit B: AI “Haves” vs. “Have Nots,” January – June 2026
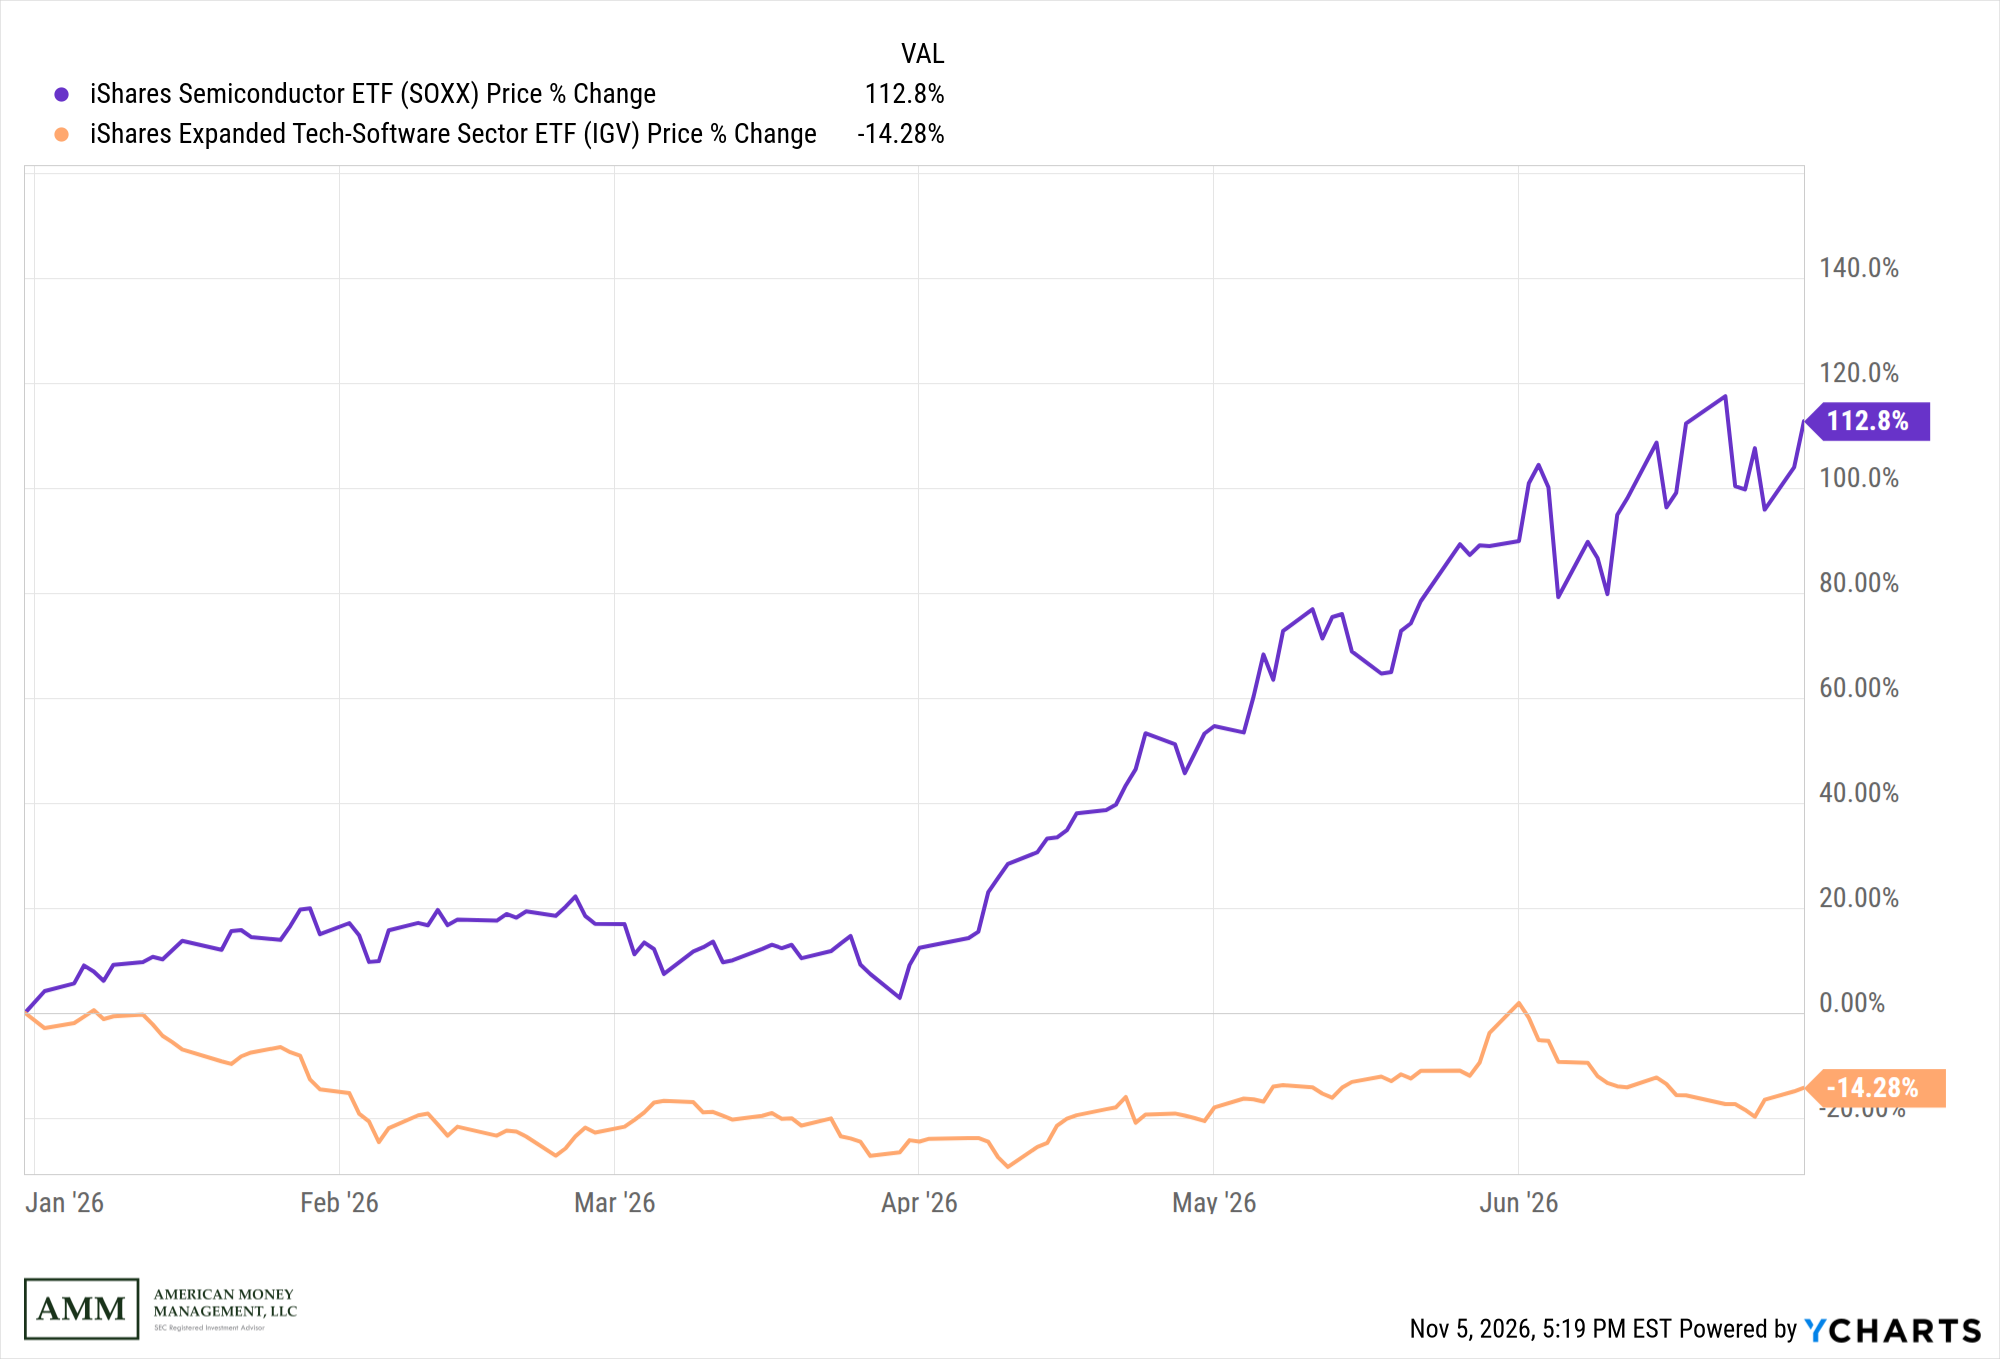
Source: AMM, YCharts. Price change only.
Then the trade reversed. From June 30 through September 30, the AI “haves” (SOXX) declined 11% while the “have nots” (IGV) gained 17% (Exhibit C).
Exhibit C: AI “Haves” vs. “Have Nots,” June – September 2026
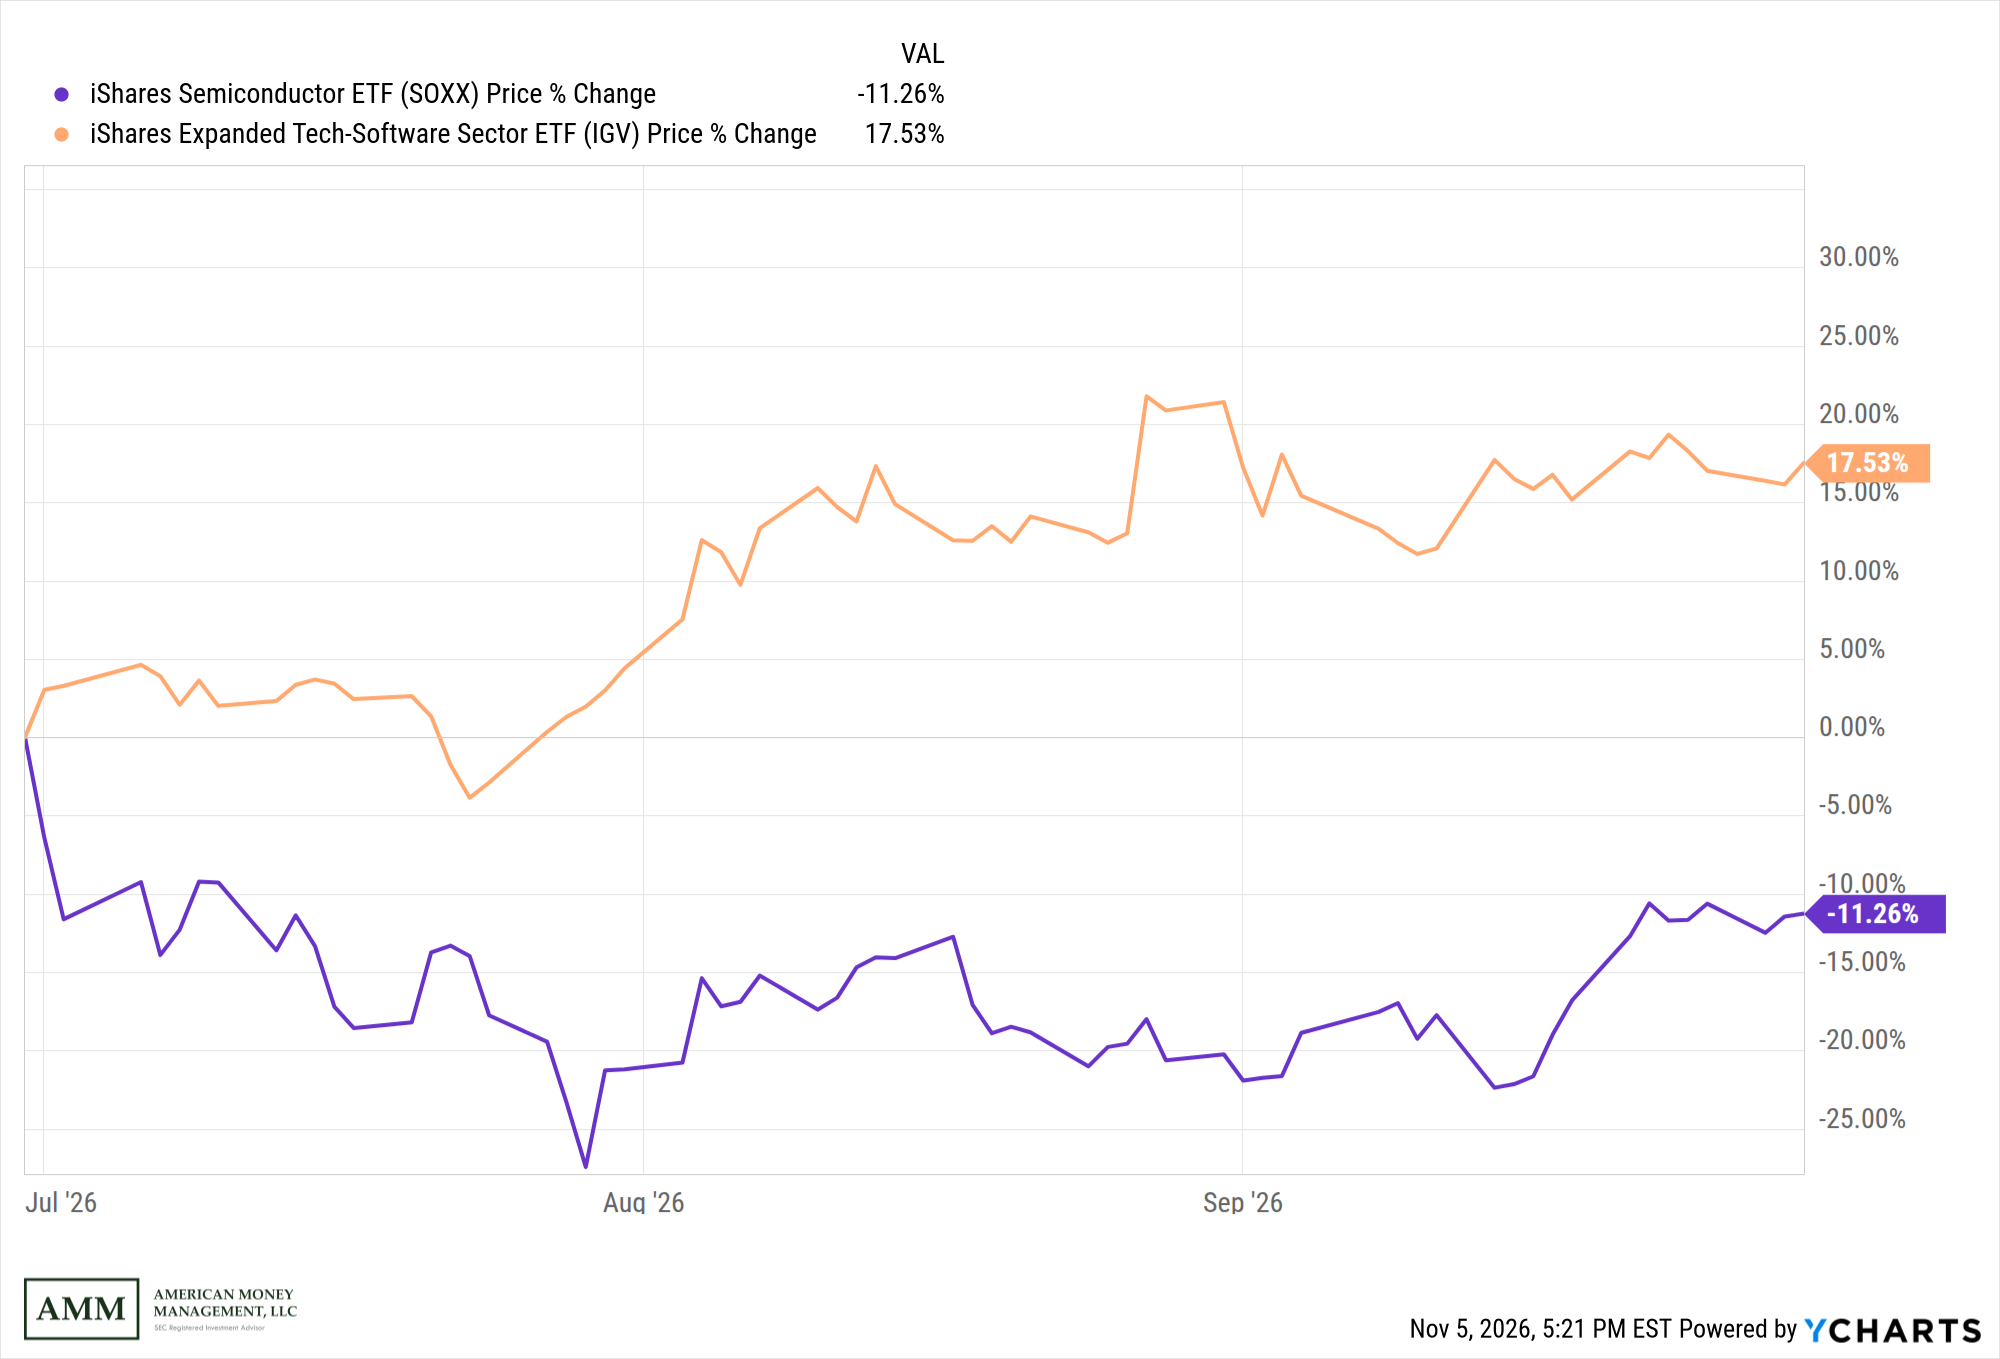
Source: AMM, YCharts. Price change only.
Since June, a healthy skepticism around AI has emerged. Will the trillions of dollars expected to be spent on AI infrastructure earn an adequate return? How will the data center buildout be financed? Are we in an AI bubble, and if so, what happens if it bursts?
If there is one certainty around AI, it is that the range of possible outcomes cannot be overstated. AI bears warn of a dystopian future in which millions of jobs disappear and a small group of AI “super companies” control an outsized share of the world’s resources. AI bulls envision something closer to utopia, with AI accelerating cures for disease and creating entirely new categories of jobs.
Given that range, we will not venture a prediction, though history suggests new technologies have generally been a net positive for wealth creation over time. What is clear is that the extreme swings in the AI trade reinforce the approach outlined in our Big Picture discussion. A portfolio built around one side of the AI debate is a large bet on being right. In short, our portfolios participate in the AI theme, but if AI disappoints, we won’t be wrong with the whole portfolio.
The Economy and the Midterm Election
As we write this letter, we are two days past the midterm election, and volatility has spiked, with markets giving back all of their post-election gains and then some. When it comes to politics and investing, we are generally agnostic. We certainly have wide and varied political views at AMM, but we park them at the door when making investment decisions. History suggests that is the right approach.
In fact, the year following a midterm election has historically been one of the better periods for stocks. Since 1946, the S&P 500 has been higher 12 months after every midterm election – 20 out of 20 – with an average gain of 14.8%. That held regardless of which party won. In 9 of those 20 elections, the president’s party lost control of the House, the Senate or both. Deutsche Bank, however, points out one important difference this time around. The S&P 500 is more concentrated in a small number of companies today than at any point in that history, so the fortunes of a few stocks carry more weight than ever. That history does not guarantee the same result over the next twelve months, and today’s concentration is one more reason we favor broad diversification over counting on the pattern to repeat.
A sharp downturn in AI stocks could weigh on markets for some time. But the most severe and lasting market declines have typically coincided with recessions, and from our current vantage point the economy looks healthy. Employment is stable to strong, GDP growth is solid, manufacturing is expanding and corporate earnings have had a stellar year. Given that backdrop, along with a healthy dose of skepticism around AI, we do not view this as a time for significant de-risking.
International Stocks
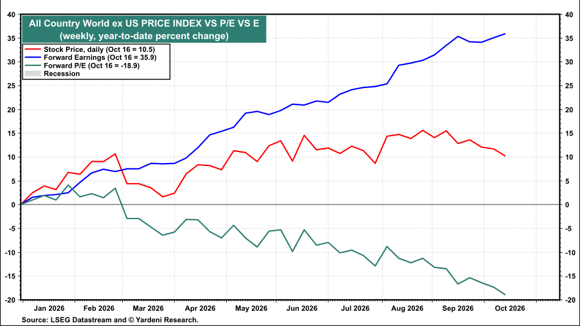
According to Yardeni Research, the All Country World ex-US MSCI was up 10.5% year-to-date in mid-October, while its forward earnings were up nearly 36%. The result is a forward P/E of roughly 12 times, versus about 19 times for US stocks – a 57% premium, only about half of which is explained by higher US profit margins (Exhibit D).
Exhibit D: International Stocks – Prices vs. Forward Earnings, 2026
Source: LSEG Datastream and © Yardeni Research. MSCI.
On the surface, these numbers suggest a potential bargain in non-US stocks. Effectively investors can now pay about 20% less per dollar of future earnings on a broad basket of international stocks than they could at the start of the year.
But for US-based investors, owning international stocks means adding currency and geopolitical risk to a portfolio. This year has offered examples of both. European stocks have been held back by France’s fiscal troubles, which have pushed bond yields higher across the region, and by a weaker euro, which reduces returns for dollar-based investors. As of quarter end, European stocks were up 6% year-to-date in dollar terms vs. 14% for All Country World ex-US MSCI Index. In emerging markets, much of this year’s gain has come from a small number of AI-related companies. Two South Korean companies represent 12% of the Emerging Markets Index. This vulnerability showed up in South Korea’s sharp sell-off in October. The market is now down more than 38% from its July peak, but still up nearly 40% in the year.
None of these are reasons to avoid investing internationally. The benefits, namely broader diversification and the potential for better risk-adjusted returns, may well outweigh the downside, but investors should be aware of the tradeoffs.
Our international allocation is not a bet that overseas stocks will beat the US next quarter. We start with the non-US share of the global stock market, currently around 35%, and typically allocate less than that. First, many of the US companies we own already generate a significant share of their revenue overseas, giving our domestic holdings meaningful international exposure on their own. Second, a more modest weight lets us capture the diversification and valuation benefits of investing abroad while limiting the currency and geopolitical risks described above.
Fixed Income
Bond yields have moved higher around the world this year, and the Fed has changed direction. After cutting rates a cumulative 1.75% since September 2024, the Fed raised rates by 0.25% in September, with Chair Kevin Warsh describing the move as removing “a dose of accommodation.” At its late-October meeting the Fed held the federal funds rate at 3.75%–4.00%, though two members voted for another hike. Inflation remains the sticking point, with September consumer prices up 3.7% from a year ago and higher energy prices still working their way through the economy. The 10-year Treasury yield sat near 5.1% in mid-October.
For savers, the good news is that yields of this level offer a real return above inflation, and a far better starting point for future bond returns than anything available during the zero-rate era. But with inflation still running hot and the Fed possibly not done, we continue to favor shorter-duration bonds, where a wrong call on the direction of rates is far less costly. We also remain cautious on credit. High yield spreads widened in late October, and lending growth in the less transparent private credit market has drawn increasing attention. As we noted last quarter, the fixed income portion of a portfolio is there to provide the return of capital.
Should you have any questions regarding your investment account(s) and personal financial plans, or if there have been any recent changes to your investment and/or retirement objectives, please do not hesitate to contact our office to speak with one of us at your convenience. We can also provide you with a current copy of our ADV Part 2, at your request.
As always, we thank you for entrusting AMM to help you achieve your investment and retirement objectives.
Sincerely,
Your Portfolio Management Team
*Individual accounts will vary based on a client’s stated investment objectives, risk tolerance and time frame. We manage several different strategies, so not every client has exposure to the securities, asset classes or strategies described above. In addition to growth and/or income-oriented asset allocation strategies, we also manage more concentrated equity portfolios that generally carry a higher degree of risk and volatility.