

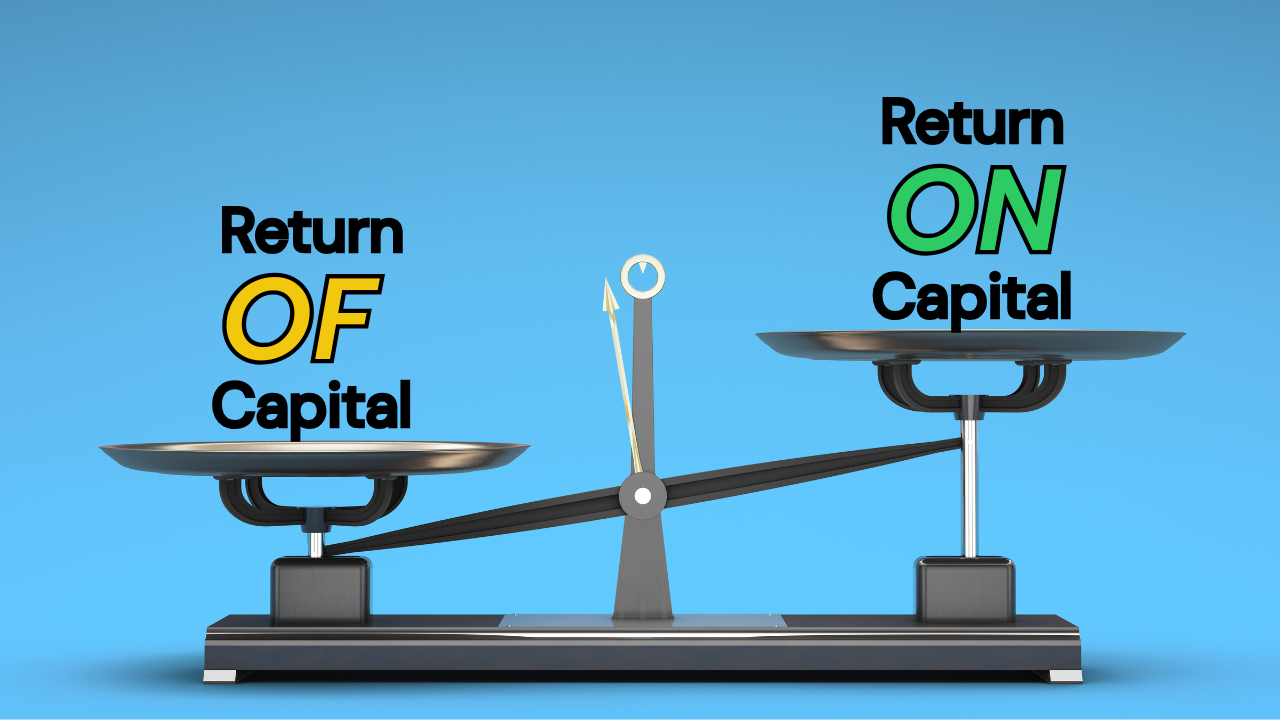
Will Rogers is often credited with the line that he was not so much concerned with the return on his money as with the return of his money. It reads as a joke, but the distinction is serious, and it is the foundation of how we think about risk. The return on capital is what an investor hopes to earn for putting money at risk. The return of capital is what an investor assumes will still be there when it is needed. These are two separate objectives; and in long bull markets they have a way of blurring into one.
The period since the 2008/09 financial crisis has been among the more rewarding stretches in US stock market history, interrupted only briefly and, each time, resolved faster than most expected. That is good news, and clients who remained invested through it have been well served. But extended periods of strong returns do something to the way investors view risk. Risk assets like stocks begin to feel less like risk and more like a dependable source of return. Investors become, in effect, programmed to expect that gains on stocks can be counted on.
Naturally, this goes against the whole notion of risk; that returns, or any other future outcome for that matter, cannot be counted on with certainty. Of course, there are some outcomes that have a higher probability of occurring. The likelihood of a short-term US treasury bill defaulting is so close to zero that it is effectively a risk-free investment. But with most assets — stocks, real estate, corporate bonds — there is a much larger range of potential outcomes, and this is where risk really lies.
One of our firm’s core principles addresses this directly: “volatility is not risk; risk is the likelihood of permanent capital impairment.” Every asset carries some degree of that risk, and rational investors tacitly accept it. However, after long stretches of above average returns, this acceptance can become muted, or even disappear entirely. High returns on capital are assumed to come with a near certain return of capital.
This conflation of return on and return of capital amplifies risk, as investors may seek to increase exposure to risk assets well above their base comfort level or, even worse, their financial capacity to take risk. This second-order effect can be more damaging than the impairment risk of any individual holding, because it determines whether an investor is still able to hold the position when it declines. An investor who has stretched beyond their capacity is the one most likely to sell at the bottom — converting a temporary decline into a permanent impairment.
None of this is intended to be alarmist, or some kind of bearish call on the direction of markets. In fact, as we outline in the outlook section below, we see reasons to be optimistic about markets and the economy. However, periodically re-thinking risk exposures is an important exercise, especially following long periods of strong returns.
Risk Management Strategies
There are three primary ways we work to keep portfolio risk aligned with a client’s actual tolerance for it rather than with recent market behavior. None requires a view on where markets go next.
Rebalancing
A balanced portfolio allocation that began at sixty percent stocks and forty percent fixed-income may sit closer to seventy-five percent stocks after a long advance — not through any decision, but because the stock portion grew faster than everything else. The strategy target remains “balanced”; the portfolio no longer is. Rebalancing — trimming what has performed well and adding to what has lagged — is the mechanism that returns a portfolio to the risk level aligned with your risk tolerance and long-term objectives. However, rebalancing can feel counterintuitive at the moment it is done. Selling a portion of your best-performing holding to add to something that has disappointed you runs against instinct. But rebalancing is not a market call – it simply restores the portfolio to its intended asset mix, with the added benefit of mechanically “buying low” and “selling high”.
Diversification
Diversification, not putting all of your eggs in one basket, is a standard principle of investing, but is often misunderstood. A portfolio composed of 500 stocks (S&P 500) diversifies your large-cap US stock risk and helps to avoid single stock or concentration risk. But it doesn’t diversify your exposure to the US stock market. Real diversification is about diversifying your risk exposure across various asset classes.

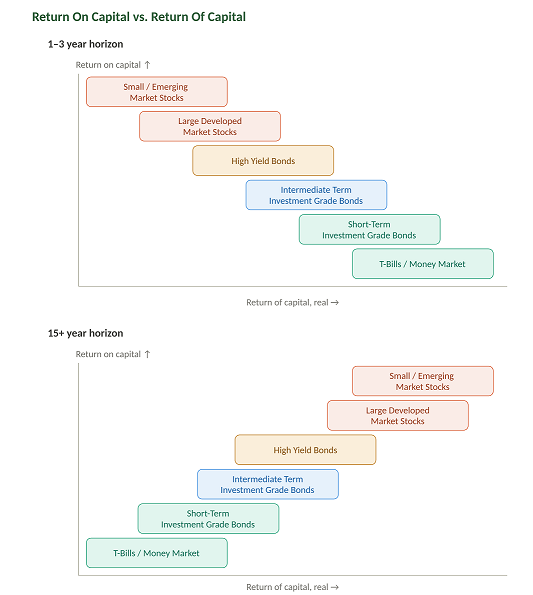
Exhibit A plots a representative — though not exhaustive — set of asset classes commonly used in portfolio construction against two questions: what return on capital can reasonably be expected, and how dependable is the return of capital? Two features are worth noting. First, return of capital is measured in real terms, after inflation — because preserving nominal dollars while losing purchasing power is still a loss. Second, the positions are not fixed. Over a one-to-three year horizon, t-bills and money market funds sit at the dependable end and stocks at the opposite. Extend the horizon to fifteen years or more and they trade places: stocks have historically become the more reliable store of inflation-adjusted value, while cash has become the less reliable one. The same asset can be the conservative choice or the aggressive one depending entirely on when the money is needed.
Exhibit A
Price Paid
Where an asset sits on that matrix is not determined by time alone. Starting conditions matter. One of AMM’s five core principles addresses precisely this: “the price you pay determines your return.” Pay too high a price for any asset and future expected returns will likely be lower, all else being equal. So a high return on capital depends not only on how long you hold something, but on what you paid for it at the outset. The return of capital is just as sensitive to price, and in the near term more so — an expensive asset has further to fall, and far less margin for error if the earnings that justified the price fail to arrive on schedule.
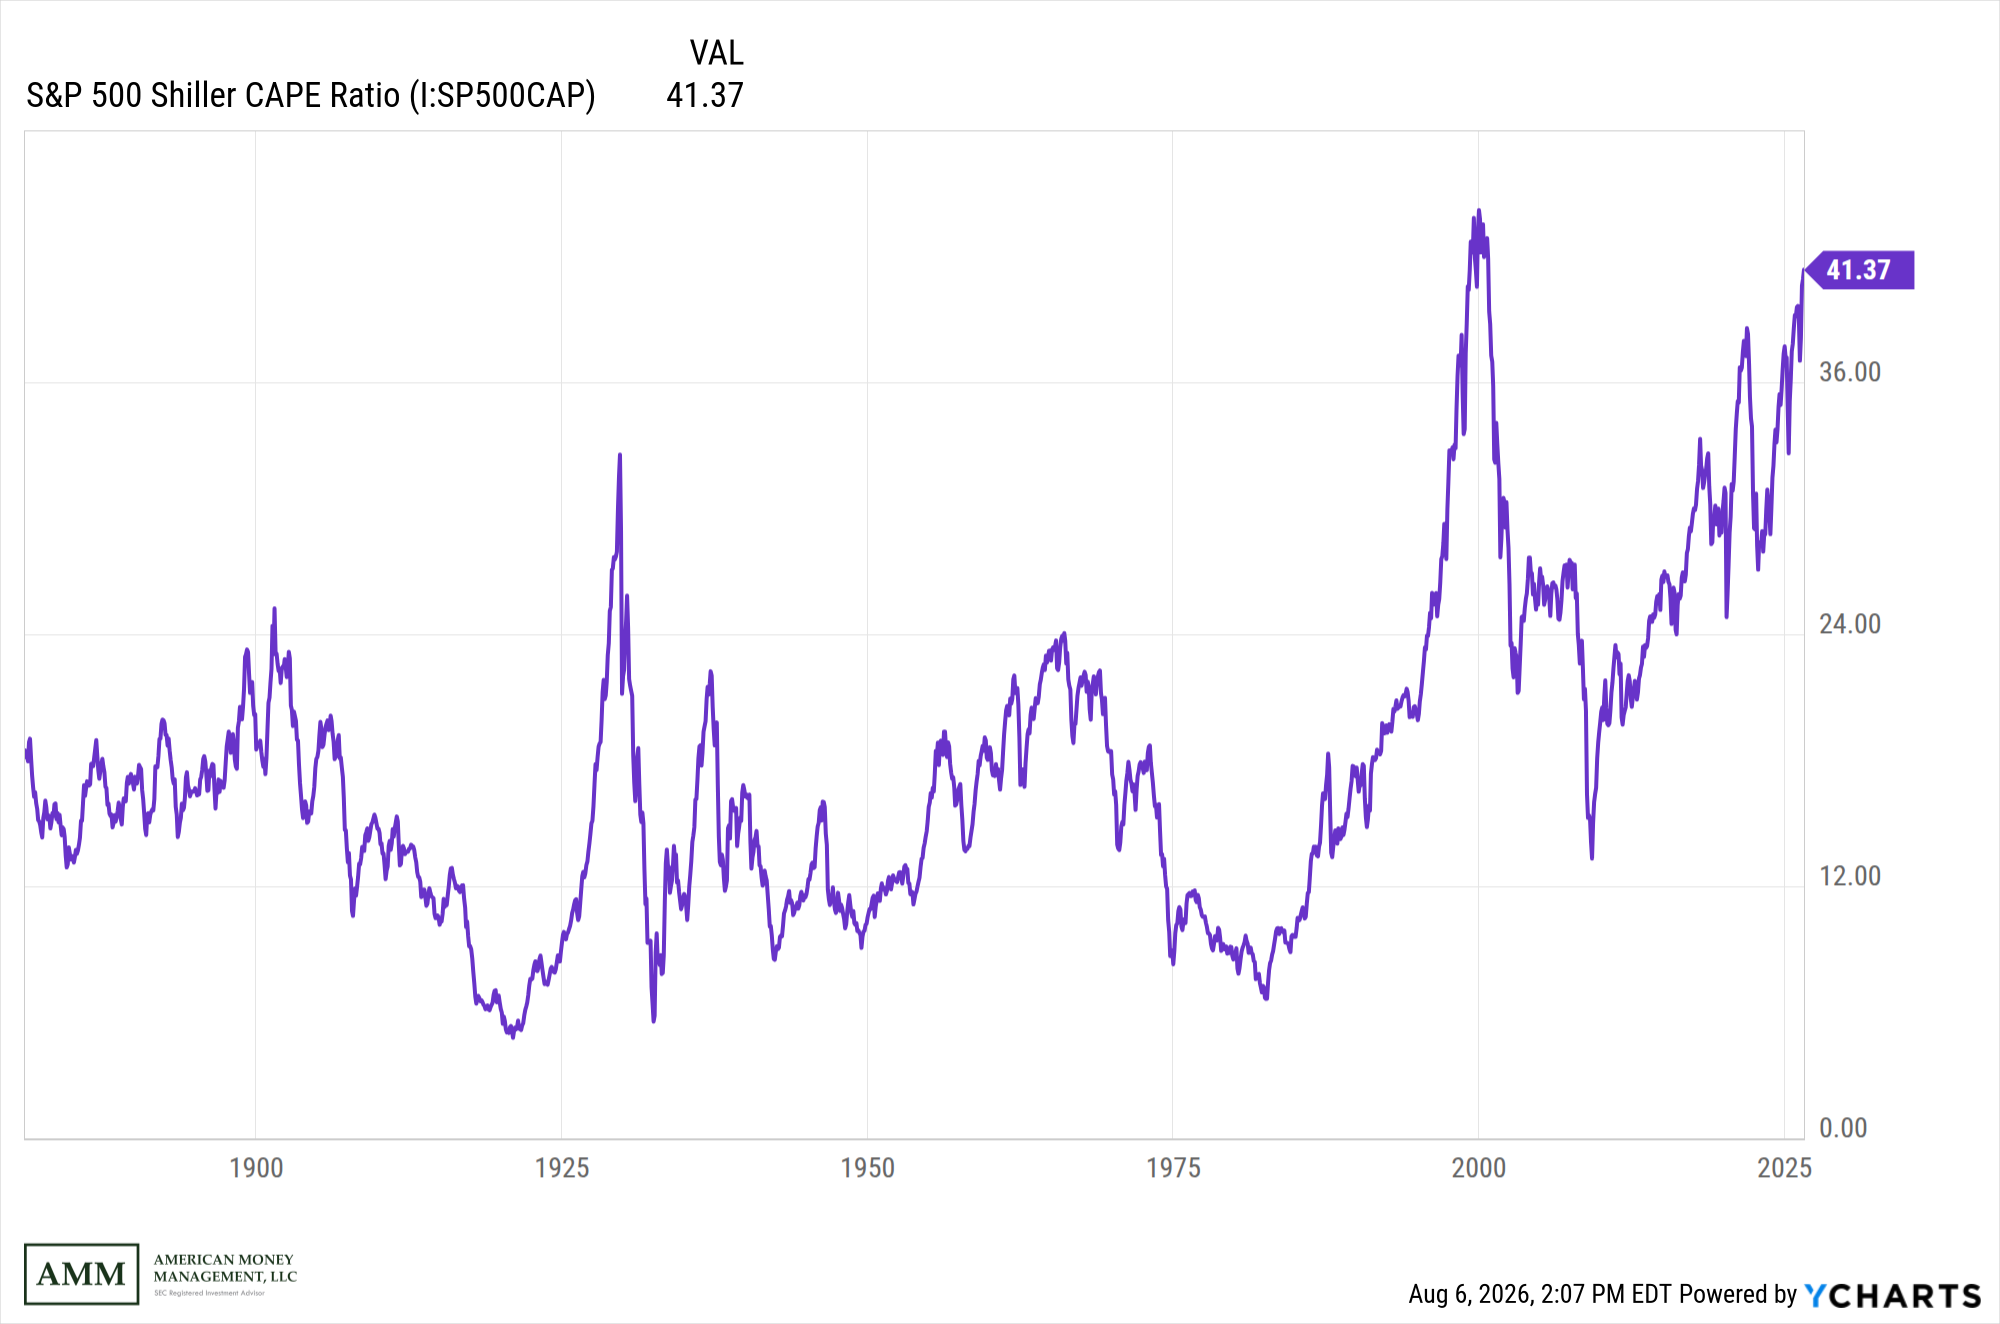
Today the S&P 500’s cyclically adjusted price-to-earnings ratio — which divides the index price by ten years of inflation-adjusted average earnings — sits near 41 (Exhibit B), against a long-run median of roughly 16. On forward earnings estimates the picture is less severe: about 20 times, only modestly above the five- and ten-year averages, helped considerably by the sharp upward revisions to 2026 earnings over the course of this year. Both readings are true. The forward multiple tells you what investors are paying for next year’s expected profits; the cyclically adjusted ratio tells you how those profits compare against a full cycle of history. The gap between the two is itself the observation — a great deal of the current market valuation rests on earnings growth that has been forecast but not yet delivered.
Exhibit B
Source: AMM, YCharts.
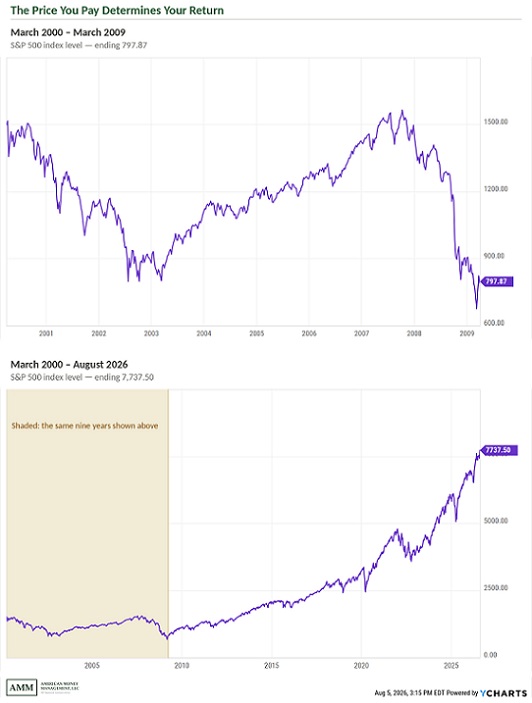
History offers a reasonably clear lesson about what elevated starting valuations can mean. An investor who bought the S&P 500 in March 2000, near the peak of the internet bubble, spent the following nine years with nothing to show for it — the index produced a negative total return over that entire stretch (Exhibit C, upper panel). That is not a market decline; it is a decade of opportunity cost, and it happened to investors who were substantially right about the transformative nature of the internet, but wrong about the price. But extend that same starting point to the present day and the picture inverts (lower panel). The lost decade now registers as a shaded block in the corner of a line that has climbed a great deal higher. Both panels describe the same investment, bought on the same day. The only variable that changed is how long the investor was willing and able to hold it.
Exhibit C
Source: AMM, YCharts.
The lesson of that period is not that investors should have been better at spotting a bubble. It is that the price they paid had quietly removed their margin of safety. Buying near the top in 1999 did not guarantee a lost decade — it raised the odds of one, and left nothing in reserve if the optimism turned out to be early, mis-priced or simply wrong. Investors who understood that distinction had a real edge in the years that followed, not because they predicted anything, but because they behaved differently. They kept rebalancing. They held a genuinely diversified portfolio. They were willing to buy the less exciting assets that were cheap precisely because nobody wanted them. The investor who never accepted that the odds had shifted tended to do the opposite — concentrating further into the story, under-diversifying, and treating the price paid as irrelevant.
We want to be clear that none of this is a bubble call. No one can predict the future, and we are not attempting to. Valuations have been above average for much of the past decade, and there has been no shortage of opportunity to declare a bubble over that stretch — most of those calls were wrong, and acting on them was expensive. Our point is a narrower one. Elevated prices reduce the margin of safety, and a thinner margin of safety is a reason to be deliberate about rebalancing, diversification and what we pay for what we own. It is not a reason to step aside. That deliberateness is what protects the return of capital; and the return of capital is what gives the return on capital the time it needs to compound.
Year-To-Date Performance Review
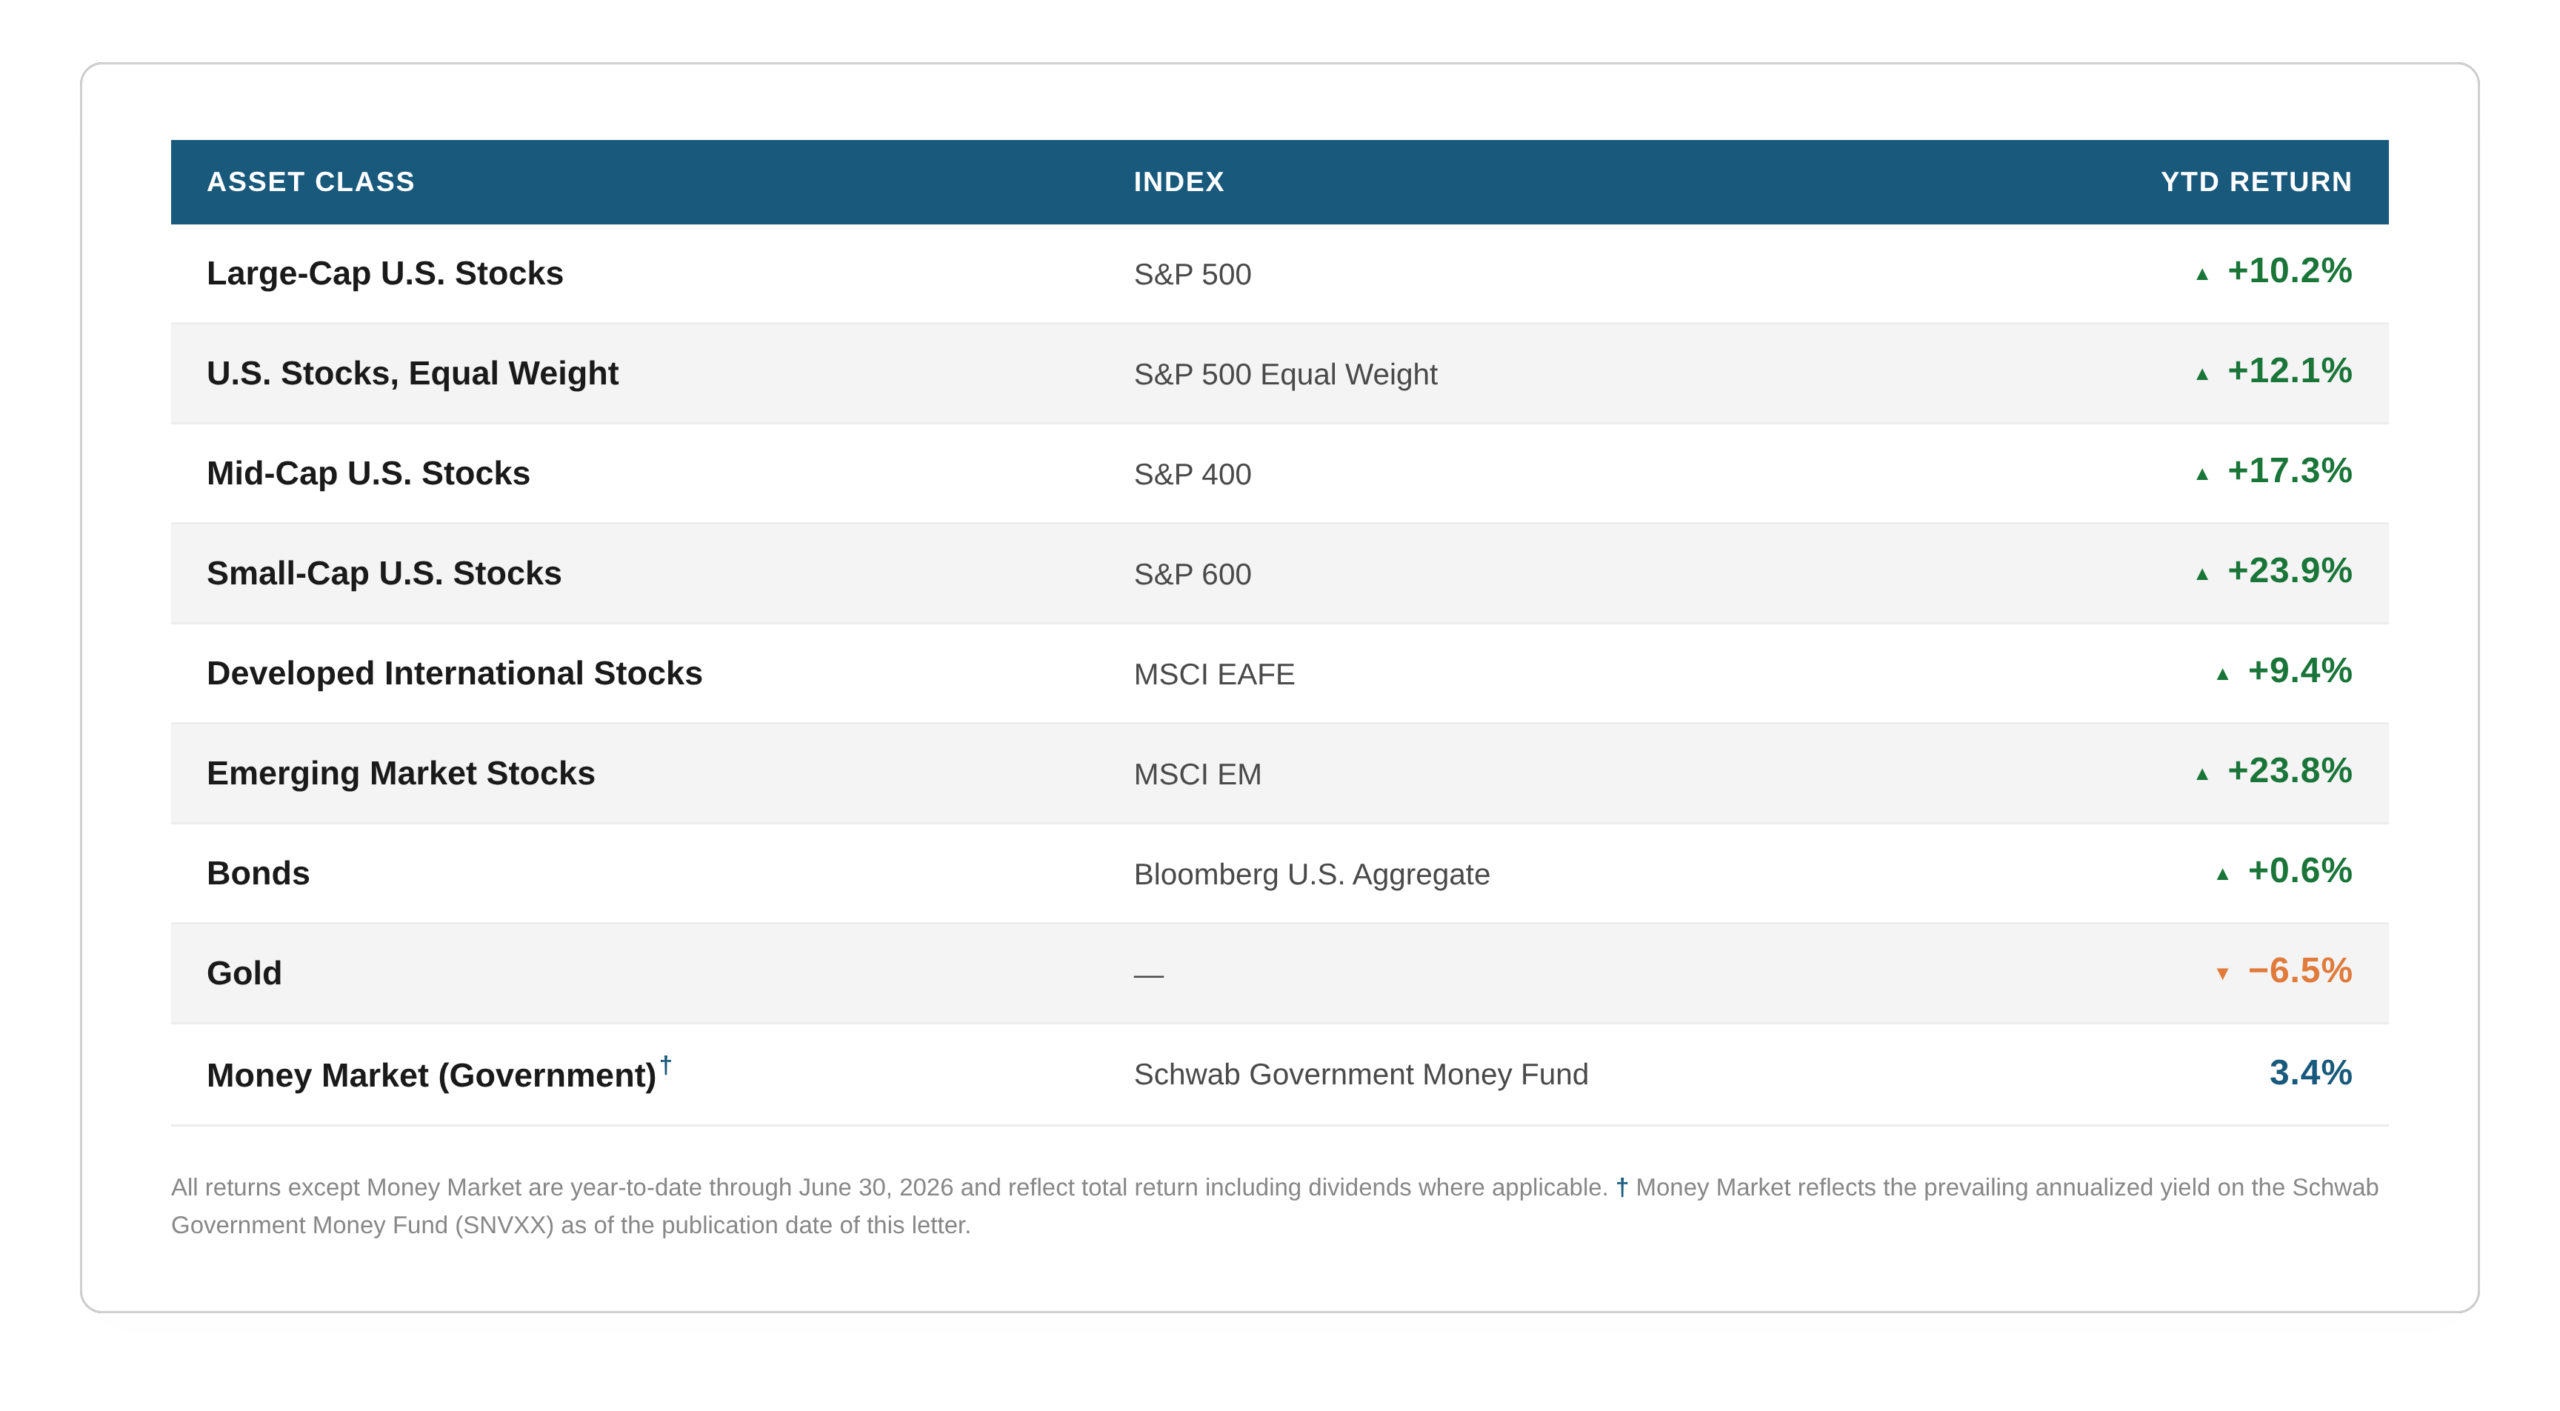
The first half was not a quiet one. The S&P 500 began the year at 6,845 and drifted higher into late January before declining through March, when the U.S./Israel-Iran conflict broke out, oil prices surged and inflation readings moved higher. The index bottomed on March 30 at 6,344 — a decline of roughly 9% from its January high, and a reminder that pullbacks of this size are a routine feature of equity investing rather than an aberration. Markets then looked past those events and rallied to a new all-time high of 7,610 on June 2, finishing the quarter modestly below that level.
Current Outlook
U.S. Stocks
The earnings picture has been strong, and it has also been broad. Consensus estimates for the second quarter implied 18.2% year-over-year growth when the quarter began; by the end of June that had risen to 23.7% — unusual, since according to analysis from Yardeni Research estimates almost always drift lower as a quarter progresses. Breadth improved alongside it. Ten of the eleven S&P 500 sectors are expected to post positive year-over-year earnings growth in the second quarter, up from nine in the first, and all eleven are expected to grow revenues. Whatever else can be said about this market, the earnings underneath it are not narrow.
One thing we are watching. While estimates continue to rise, the rate at which they are rising has slowed; research from The Earnings Scout puts the current pace of upward revision at 1.30%, down from a 3.20% peak during the first quarter season. Deceleration is not decline, and we draw no conclusion from a single quarter. But the broadening described above is a meaningful part of what has been supporting prices, and it is worth knowing if that support begins to narrow. In the meantime, our domestic equity exposure continues to extend well beyond the largest index constituents, with meaningful allocations to small and mid-sized companies where the prices being paid remain more reasonable. The earnings have been excellent; that is not the same thing as the stocks being cheap.
International Stocks
For roughly fifteen years, the case for international diversification was easy to make analytically and difficult to live with. U.S. stocks simply outperformed, year after year, and any allocation away from them looked like a mistake in hindsight. That ratio has now turned (Exhibit D). After a decade and a half in favor of the U.S., the relative performance line has rolled over.
Exhibit D
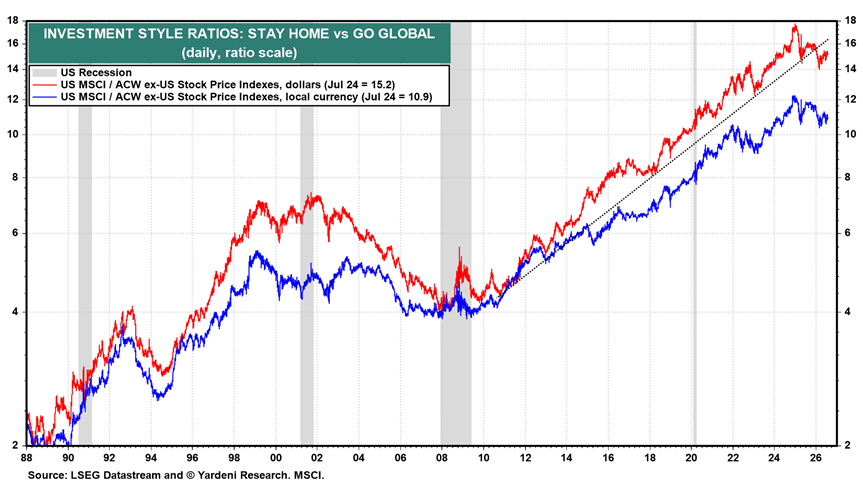
Source: LSEG Datastream and © Yardeni Research. MSCI.
The case does not rest on easy money. The European Central Bank raised rates in June for the first time since 2023, lifting its deposit rate to 2.25% as the Iran conflict pushed eurozone inflation to 3.2%, and markets see reasonable odds of another increase in September. Growth forecasts have come down accordingly. What supports our allocation is independent of the monetary backdrop: German fiscal expansion, positive earnings revisions across European industrials, defense and financials — the last directly benefiting from higher rates.
Valuations continue to support the case as well. Developed international stocks (Developed World Ex US MSCI) trade near 16 times forward earnings against roughly 20 times for the S&P 500. Emerging market stocks (EM MSCI) trade at approximately 11 times forward earnings. This is not a call that international will outperform from here. It is evidence that U.S. outperformance is not a permanent condition, and that a genuinely diversified allocation is doing what it is designed to do.
Fixed Income
Traditional bond investing has been a frustrating exercise for close to five years. Over that period money market funds have outperformed nearly every category of fixed income — an unusual outcome, and one that reflects how much damage rising rates did to bond prices beginning in 2021. The good news, as we have noted in prior letters, is that starting yields are now materially better than they were. The Bloomberg U.S. Aggregate offers a yield near 4.7%, which is a real return above inflation and a far better foundation for forward returns than anything available during the zero-rate era.
With inflation risks still festering, we continue to tilt client fixed income exposure toward shorter-duration assets. We are also skeptical of high yield bonds at current levels. Investment grade spreads reached their tightest levels since 1998 earlier this year, and high yield spreads remain near historic tights — investors are being asked to accept credit and default risk for very little additional compensation. That is not a forecast of defaults; the corporate backdrop appears reasonably healthy. We would simply rather not be paid poorly for taking a risk we do not need to take.
Which returns us to where this letter began. Fixed income is not in a client portfolio to generate the return on capital. It is there to provide the return of capital — the ballast that allows the stock allocation the time it needs to compound. Reaching for yield in the fixed income sleeve quietly converts it from the stable portion of the portfolio into another source of equity-like risk, which defeats the purpose of holding it.
Should you have any questions regarding your investment account(s) and personal financial plans, or if there have been any recent changes to your investment and/or retirement objectives, please do not hesitate to contact our office to speak with one of us at your convenience. We can also provide you with a current copy of our ADV Part 2, at your request.
As always, we thank you for entrusting AMM to help you achieve your investment and retirement objectives.
Sincerely,
Your Portfolio Management Team
*Individual accounts will vary based on a client’s stated investment objectives, risk tolerance and time frame. We manage several different strategies, so not every client has exposure to the securities, asset classes or strategies described above. In addition to growth and/or income-oriented asset allocation strategies, we also manage more concentrated equity portfolios that generally carry a higher degree of risk and volatility.